Here's a table on the average number of peak sun hours by state.
Peak Sun Hours By State
| Ranking | State | Daily Average Peak Sun Hours |
|---|---|---|
| 1 | Arizona – AZ | 6.4 hours |
| 2 | New Mexico – NM | 6.2 hours |
| 3 | Nevada – NV | 6 hours |
| 4 | California – CA | 5.8 hours |
| 5 | Hawaii – HI | 5.7 hours |
| 6 | Colorado – CO | 5.6 hours |
| 7 | Oklahoma – OK | 5.4 hours |
| 8 | Alabama – AL | 5.3 hours |
| 9 | Florida – FL | 5.3 hours |
| 10 | Louisiana – LA | 5.3 hours |
| 11 | Texas – TX | 5.3 hours |
| 12 | Utah – UT | 5.3 hours |
| 13 | Wyoming – WY | 5.3 hours |
| 14 | Mississippi – MS | 5.2 hours |
| 15 | South Carolina – SC | 5.2 hours |
| 16 | Arkansas – AR | 5.1 hours |
| 17 | Georgia – GA | 5.1 hours |
| 18 | Idaho – ID | 5.1 hours |
| 19 | North Carolina – NC | 5.1 hours |
| 20 | Kansas – KS | 5 hours |
| 21 | Nebraska – NE | 5 hours |
| 22 | Missouri – MO | 4.9 hours |
| 23 | South Dakota – SD | 4.9 hours |
| 24 | Virginia – VA | 4.9 hours |
| 25 | Delaware – DE | 4.8 hours |
| 26 | Maryland – MD | 4.8 hours |
| 27 | Washington – WA | 4.8 hours |
| 28 | Illinois – IL | 4.7 hours |
| 29 | Iowa – IA | 4.7 hours |
| 30 | New Jersey – NJ | 4.7 hours |
| 31 | North Dakota – ND | 4.7 hours |
| 32 | Tennessee – TN | 4.7 hours |
| 33 | Indiana – IN | 4.6 hours |
| 34 | Kentucky – KY | 4.6 hours |
| 35 | Massachusetts – MA | 4.6 hours |
| 36 | Montana – MT | 4.6 hours |
| 37 | Pennsylvania – PA | 4.6 hours |
| 38 | Rhode Island – RI | 4.6 hours |
| 39 | Connecticut – CT | 4.5 hours |
| 40 | Minnesota – MN | 4.5 hours |
| 41 | New Hampshire -NH | 4.5 hours |
| 42 | Ohio – OH | 4.5 hours |
| 43 | West Virginia – WV | 4.5 hours |
| 44 | Wisconsin – WI | 4.5 hours |
| 45 | Maine – ME | 4.4 hours |
| 46 | New York – NY | 4.4 hours |
| 47 | Michigan – MI | 4.3 hours |
| 48 | Oregon – OR | 4.2 hours |
| 49 | Vermont – VT | 4.2 hours |
| 50 | Alaska - AK | 3.5 hours |
Summary
- Arizona - AZ state receives the highest number of daily average peak sun hours (6.4).
- Alaska - AK state receives the lowest number of daily average peak sun hours (3.5).
Data Source: I have used PVWatts calculator to create the above list
How to calculate peak sun hours?
PVWatts calculator will provide you with in-depth data on the number of peak sun hours your state or house rooftop receives each month and for the entire year.
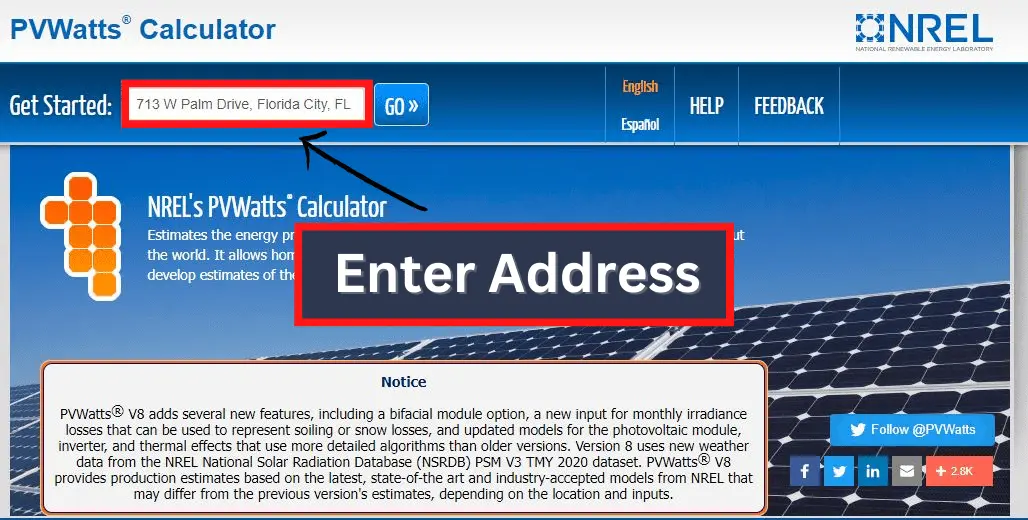
1. Enter your address (house number, street name, and zip code). Or, enter the name of your city. Then click "GO>>".
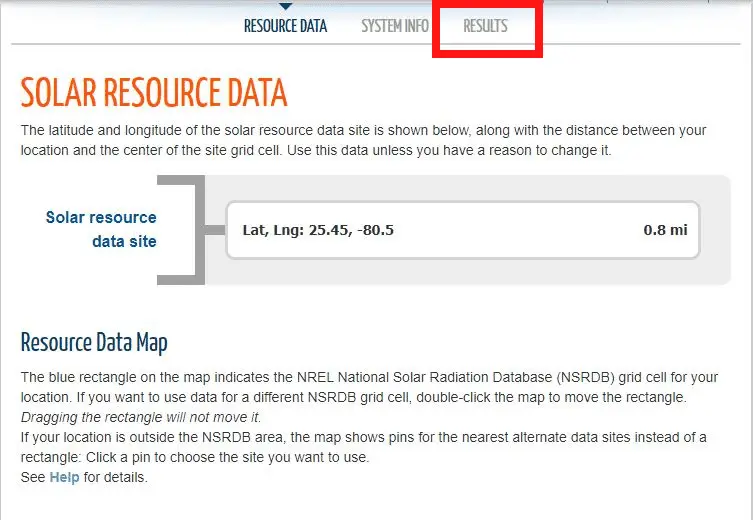
2. Now you'd jump to the "Solar Resource Data" page. Scroll down to the map (below) to confirm the location. If it's accurate, click "RESULTS".
3. You'd be able to see how much solar radiation your rooftop receives per day each month and the average total solar radiation.
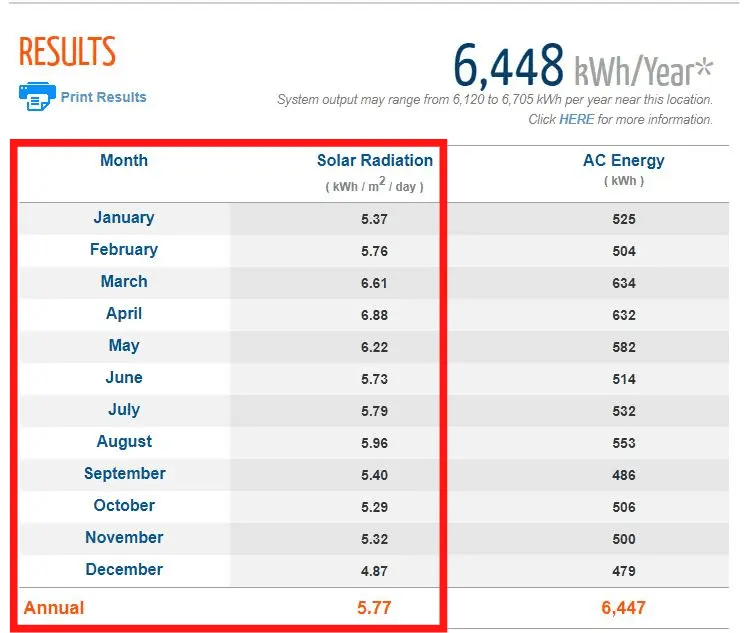
Note: 1 peak sun hour = 1 kWh / m2 of solar radiation.
I have covered this topic in detail. Read the below-mentioned post for more in-depth knowledge about peak sun hours. You'll learn the importance of peak sun hours and how to calculate the solar panel system using peak sun hours.